Skip to Main Content

Bartlett: Visual Analysis

Visual Analysis Essay Assignment

Your paper must be: 

  • Typed, 12 point Times New Roman font, double spaced, two to three pages, MLA format, include two figures
  • You must include two to three sources on the Works Cited page.  You also need to cite the sources internally.
  • You must include two figures (infographics) on the figure page, labeled as Figure 1 and Figure 2, explained, and internally cited

Prompt: 

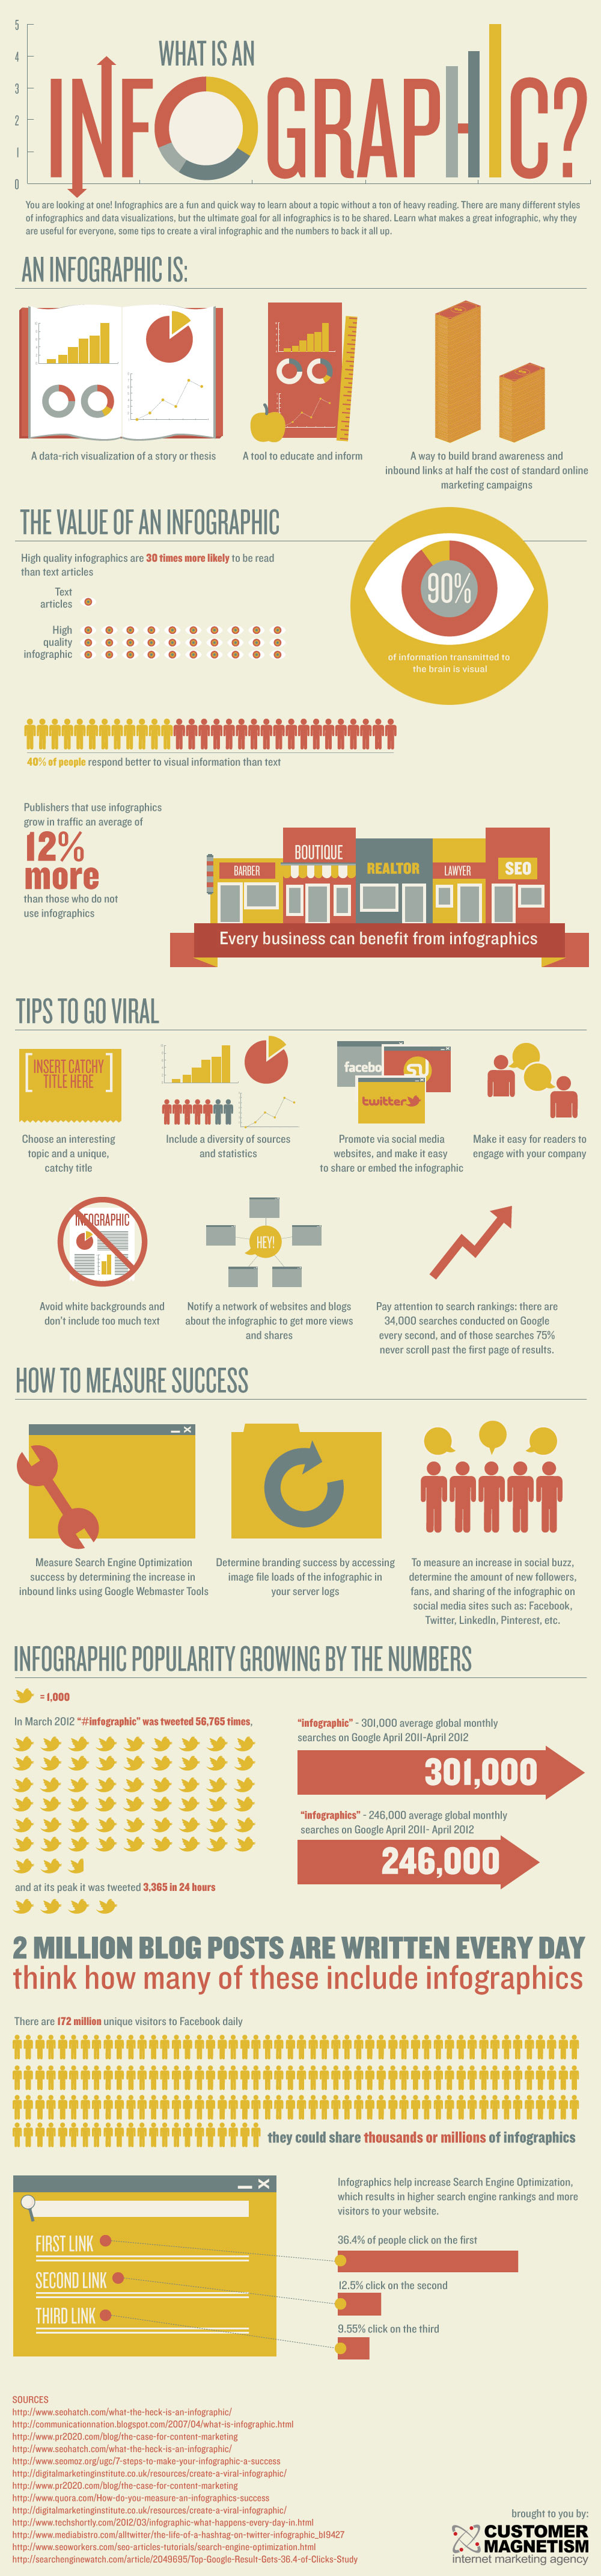
Write a two to three page visual analysis of two infographics, analyzing each infographic individually and then comparing and contrasting the elements of each infographic in regards to phrasing, graphics, and overall effect.

Steps:

  1. Make a list of possible topics on which to find infographics. (brainstorming)
  2. Locate two infographics on the same topic. (researched notes)
  3. Analyze each infographic and record your original impression.  (notes)
  4. Use a graphic organizer (chart, Venn diagram, etc.) to compare and contrast the elements of each infographic. (notes)
  5. Create an outline for your paper. (outline)
  6. Write a rough draft for your paper.
  7. After the peer review, edit and revise your paper.
  8. Finalize your paper for submission.

Parts of an Infographic

The first impression:

  • Gives the reader a first impression of what the text is going to present or argue.
  • Sets a mood for the text using images, color, font, words, and numbers.
  • When analyzing the first impression, you want to address the first things you notice about the infographic.

The story

  • What is the main argument of the infographic? Normally you will find the main argument in the title.
  • What are the main points of the infographic? Normally the main points will be written in larger font.

The data

  • What are the supporting details for the main arguments?
  • How are they presented? Using numbers, images, text--or a combination?

The strategy

  • How is the information presented?
  • How is color used?
  • How are images used?
  • How is font used?
  • Who is the target audience?

Infographic Examples

Below are links to two examples of infographics related to email safety. These examples will be used to show you how to compare/contrast/analyze visual information.  The third link listed redirects you to a website that shows you how to cite an infographic in MLA format.

Resources to Locate Infographics

Visual Rhetoric

Books on Infographics

What is an Infographic?

What is an Infographic?
Created by Customer Magnetism.