Your paper must be:
Write a two to three page visual analysis of two infographics, analyzing each infographic individually and then comparing and contrasting the elements of each infographic in regards to phrasing, graphics, and overall effect.
Below are links to two examples of infographics related to email safety. These examples will be used to show you how to compare/contrast/analyze visual information. The third link listed redirects you to a website that shows you how to cite an infographic in MLA format.

Market and consumer data and all things statistics. Downloadable data, numbers, and facts in various formats on various topics and industries.

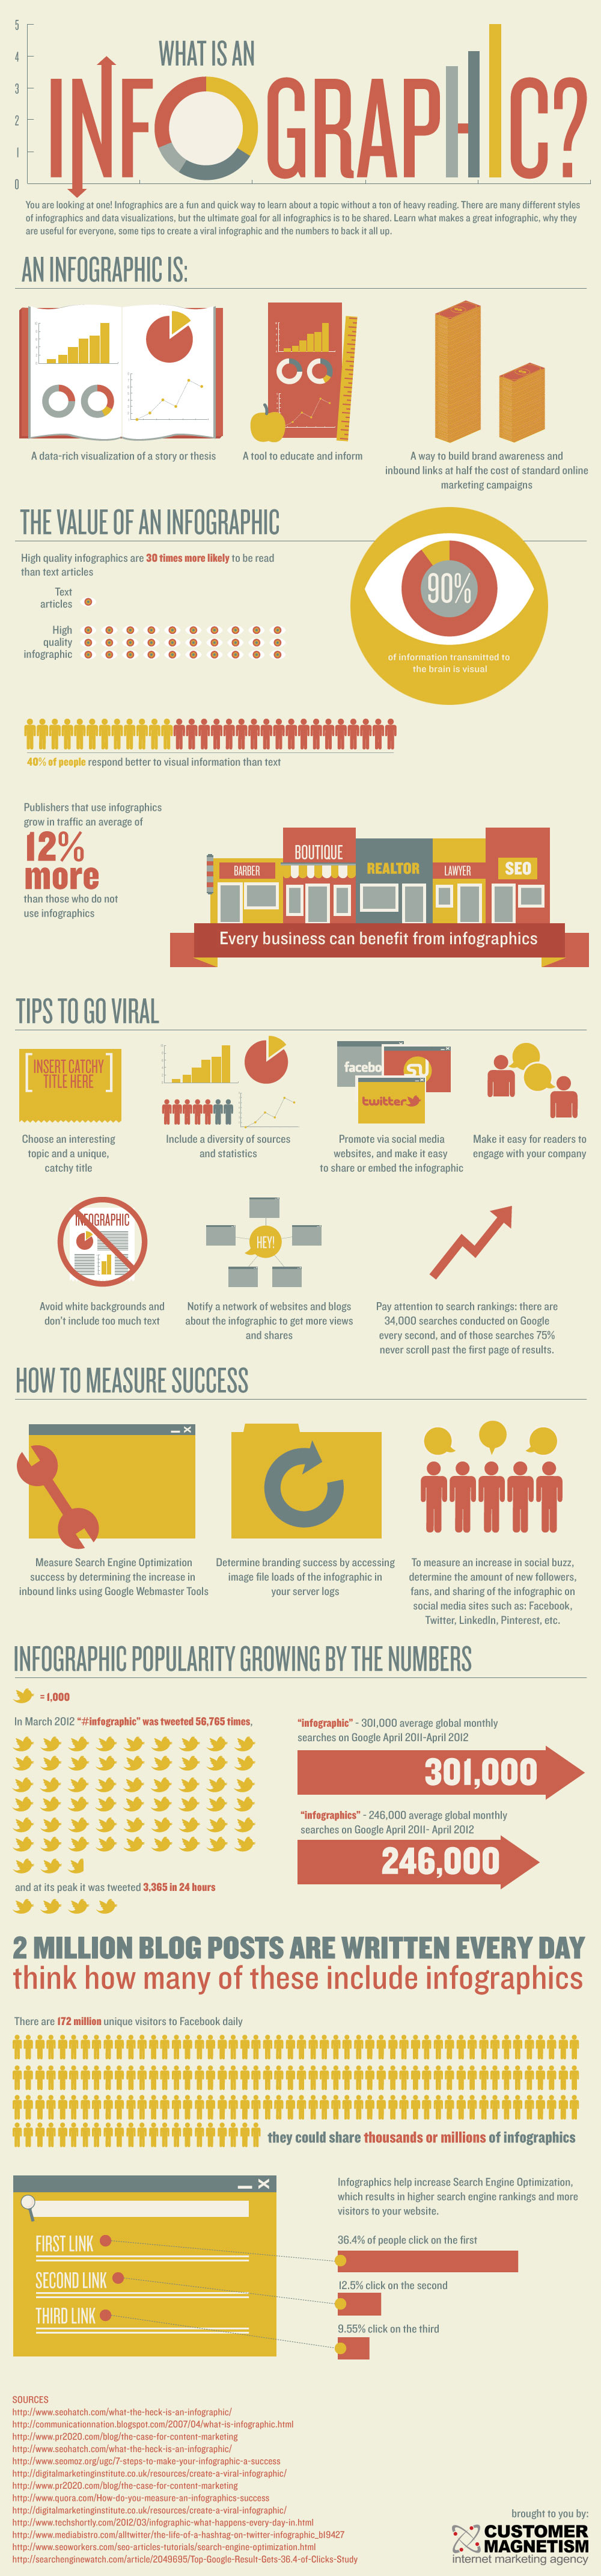
Created by Customer Magnetism.